EEG Wave Detection and Analysis#
Project: EEG Slow Wave Detection and Analysis#
- This project was published in the following paper:
- Carvalho DZ, Kremen V, Mivalt F, St Louis EK, McCarter SJ, Bukartyk J, Przybelski SA, Kamykowski MG, Spychalla AJ, Machulda MM, Boeve BF, Petersen RC, Jack CR Jr, Lowe VJ, Graff-Radford J, Worrell GA, Somers VK, Varga AW, Vemuri P. Non-rapid eye movement sleep slow-wave activity features are associated with amyloid accumulation in older adults with obstructive sleep apnoea. Brain Commun. 2024 Oct 7;6(5):fcae354. doi: 10.1093/braincomms/fcae354. PMID: 39429245; PMCID: PMC11487750.
The slow-wave detection used in this project is part of the
BrainMaze EEG package
(pip install brainmaze-eeg) as the WaveDetector class. The full project
page, including the study configurations, the numbers the demo reproduces, and
the original analysis script of the study (a historical listing that needs the
legacy BEST toolbox and does not run against brainmaze-eeg), is maintained with
the package documentation, so that it stays in sync with each release:
Project page (package docs): https://bnelair.github.io/brainmaze-eeg/project_wave_detector.html
WaveDetector API, algorithm and outputs: https://bnelair.github.io/brainmaze-eeg/features.wave_detector.html
Runnable example with sample data (
example_one_file.py, 6.8 h recording): bnelair/brainmaze-eeg
Note
Earlier versions of this page listed the original study script, which
imported best (the BEST toolbox) and an unpublished
SlowWaveDetector.py (SlowWaveDetect). That code does not run against
brainmaze-eeg. Use WaveDetector as shown below (brainmaze-eeg 3.0.0).
Quick start with brainmaze-eeg 3.0.0 (taken from the package’s project page, where both configurations are explained):
from brainmaze_eeg.features.wave_detector import WaveDetector

# x: Fz-(A1+A2)/2 in uV, sampled at fs Hz; broadband: the same signal band-passed 0.5-35 Hz

# (1) slow-oscillation (0.5-0.9 Hz) downslope as computed since v1.0.0
#     (default trough='refine'): detect on the band, measure on the broadband trace
so = WaveDetector(fs=fs, fband=(0.5, 0.9), segm_size=30,
                  slope='downslope', amplitude_threshold=5)
values, names = so(x, measure_on=broadband)   # per 30 s segment; e.g. WAVE_SLOPE_MEAN in uV/s

# (2) the Methods text of the paper (trough='paper')
so_paper = WaveDetector(fs=fs, fband=(0.5, 0.9), segm_size=30,
                        amplitude_threshold=5, trough='paper')
values, names = so_paper(x)
Acknowledgement#
F. Mivalt et V. Kremen et al., “Electrical brain stimulation and continuous behavioral state tracking in ambulatory humans,” J. Neural Eng., vol. 19, no. 1, p. 016019, Feb. 2022, doi: 10.1088/1741-2552/ac4bfd.F. Mivalt et V. Sladky et al., “Automated sleep classification with chronic neural implants in freely behaving canines,” J. Neural Eng., vol. 20, no. 4, p. 046025, Aug. 2023, doi: 10.1088/1741-2552/aced21.Gerla, V., Kremen, V., Macas, M., Dudysova, D., Mladek, A., Sos, P., & Lhotska, L. (2019). Iterative expert-in-the-loop classification of sleep PSG recordings using a hierarchical clustering. Journal of Neuroscience Methods, 317(February), 61–70. https://doi.org/10.1016/j.jneumeth.2019.01.013Kremen, V., Brinkmann, B. H., Van Gompel, J. J., Stead, S. (Matt) M., St Louis, E. K., & Worrell, G. A. (2018). Automated Unsupervised Behavioral State Classification using Intracranial Electrophysiology. Journal of Neural Engineering. https://doi.org/10.1088/1741-2552/aae5ab
Version#
Original study code: version 1.0 (2024-07-05) by V. Kremen (Kremen.Vaclav@mayo.edu).
Examples#
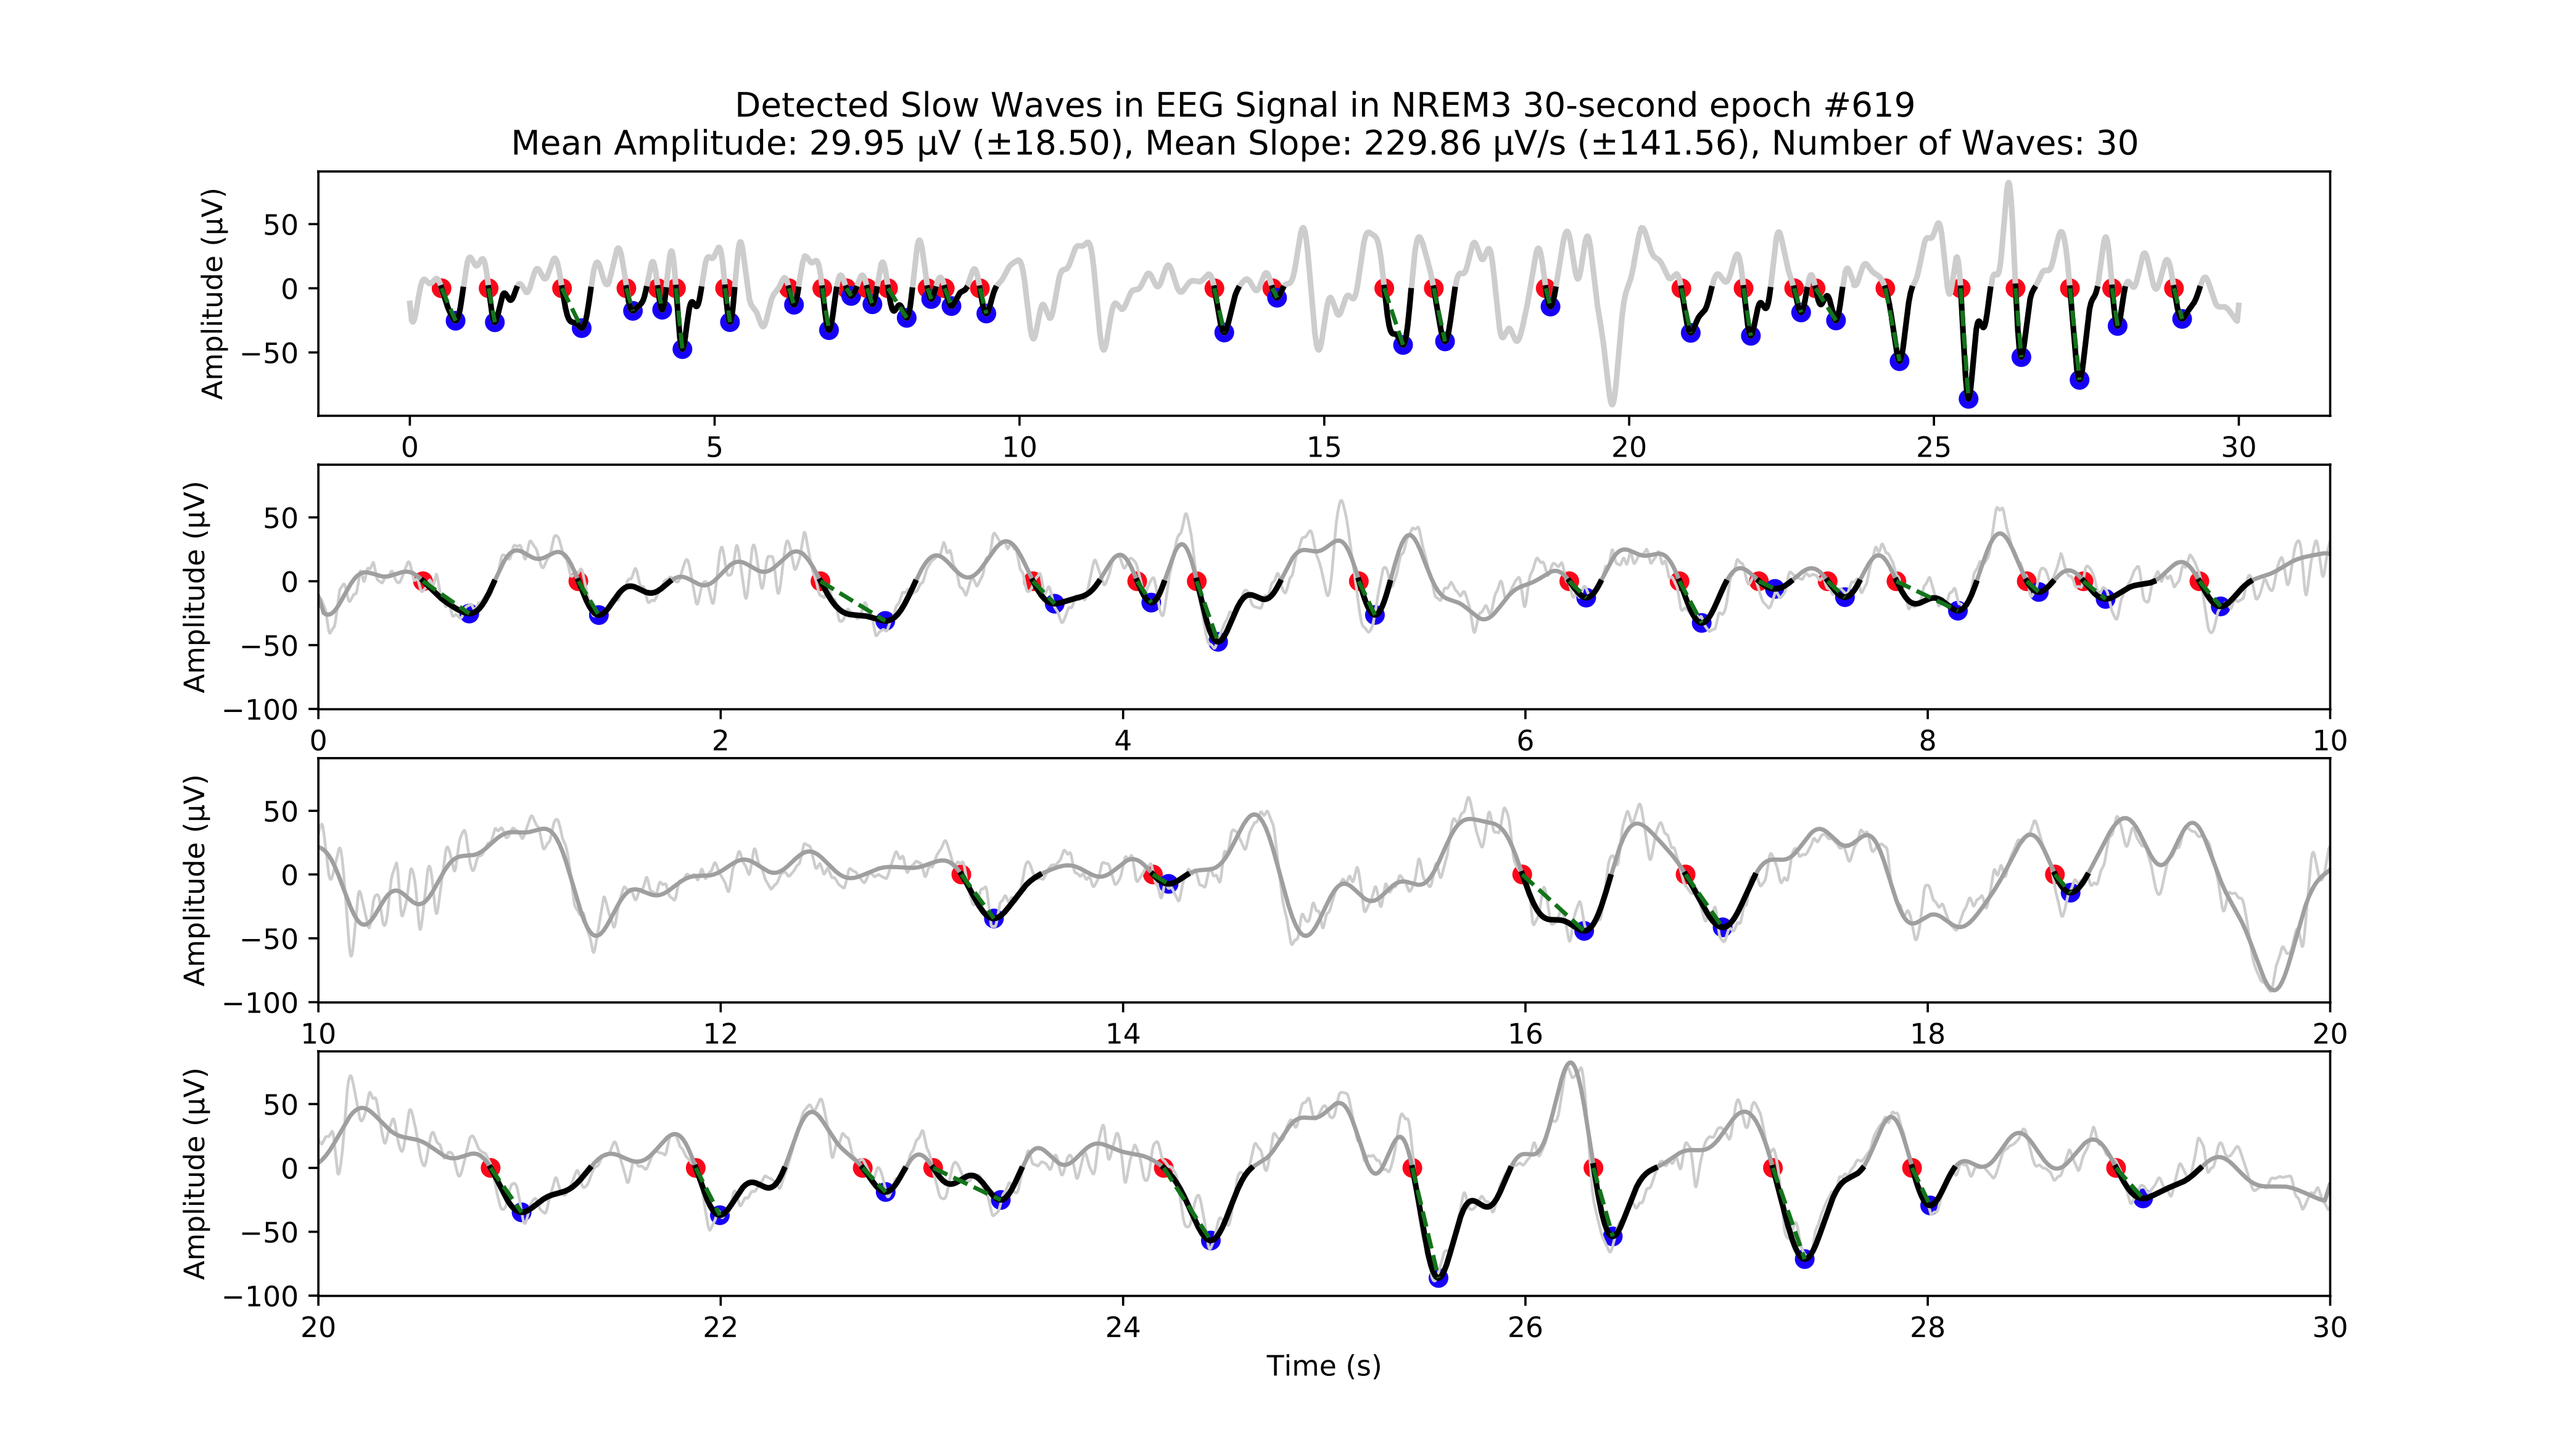
Example of individual slow wave detections.
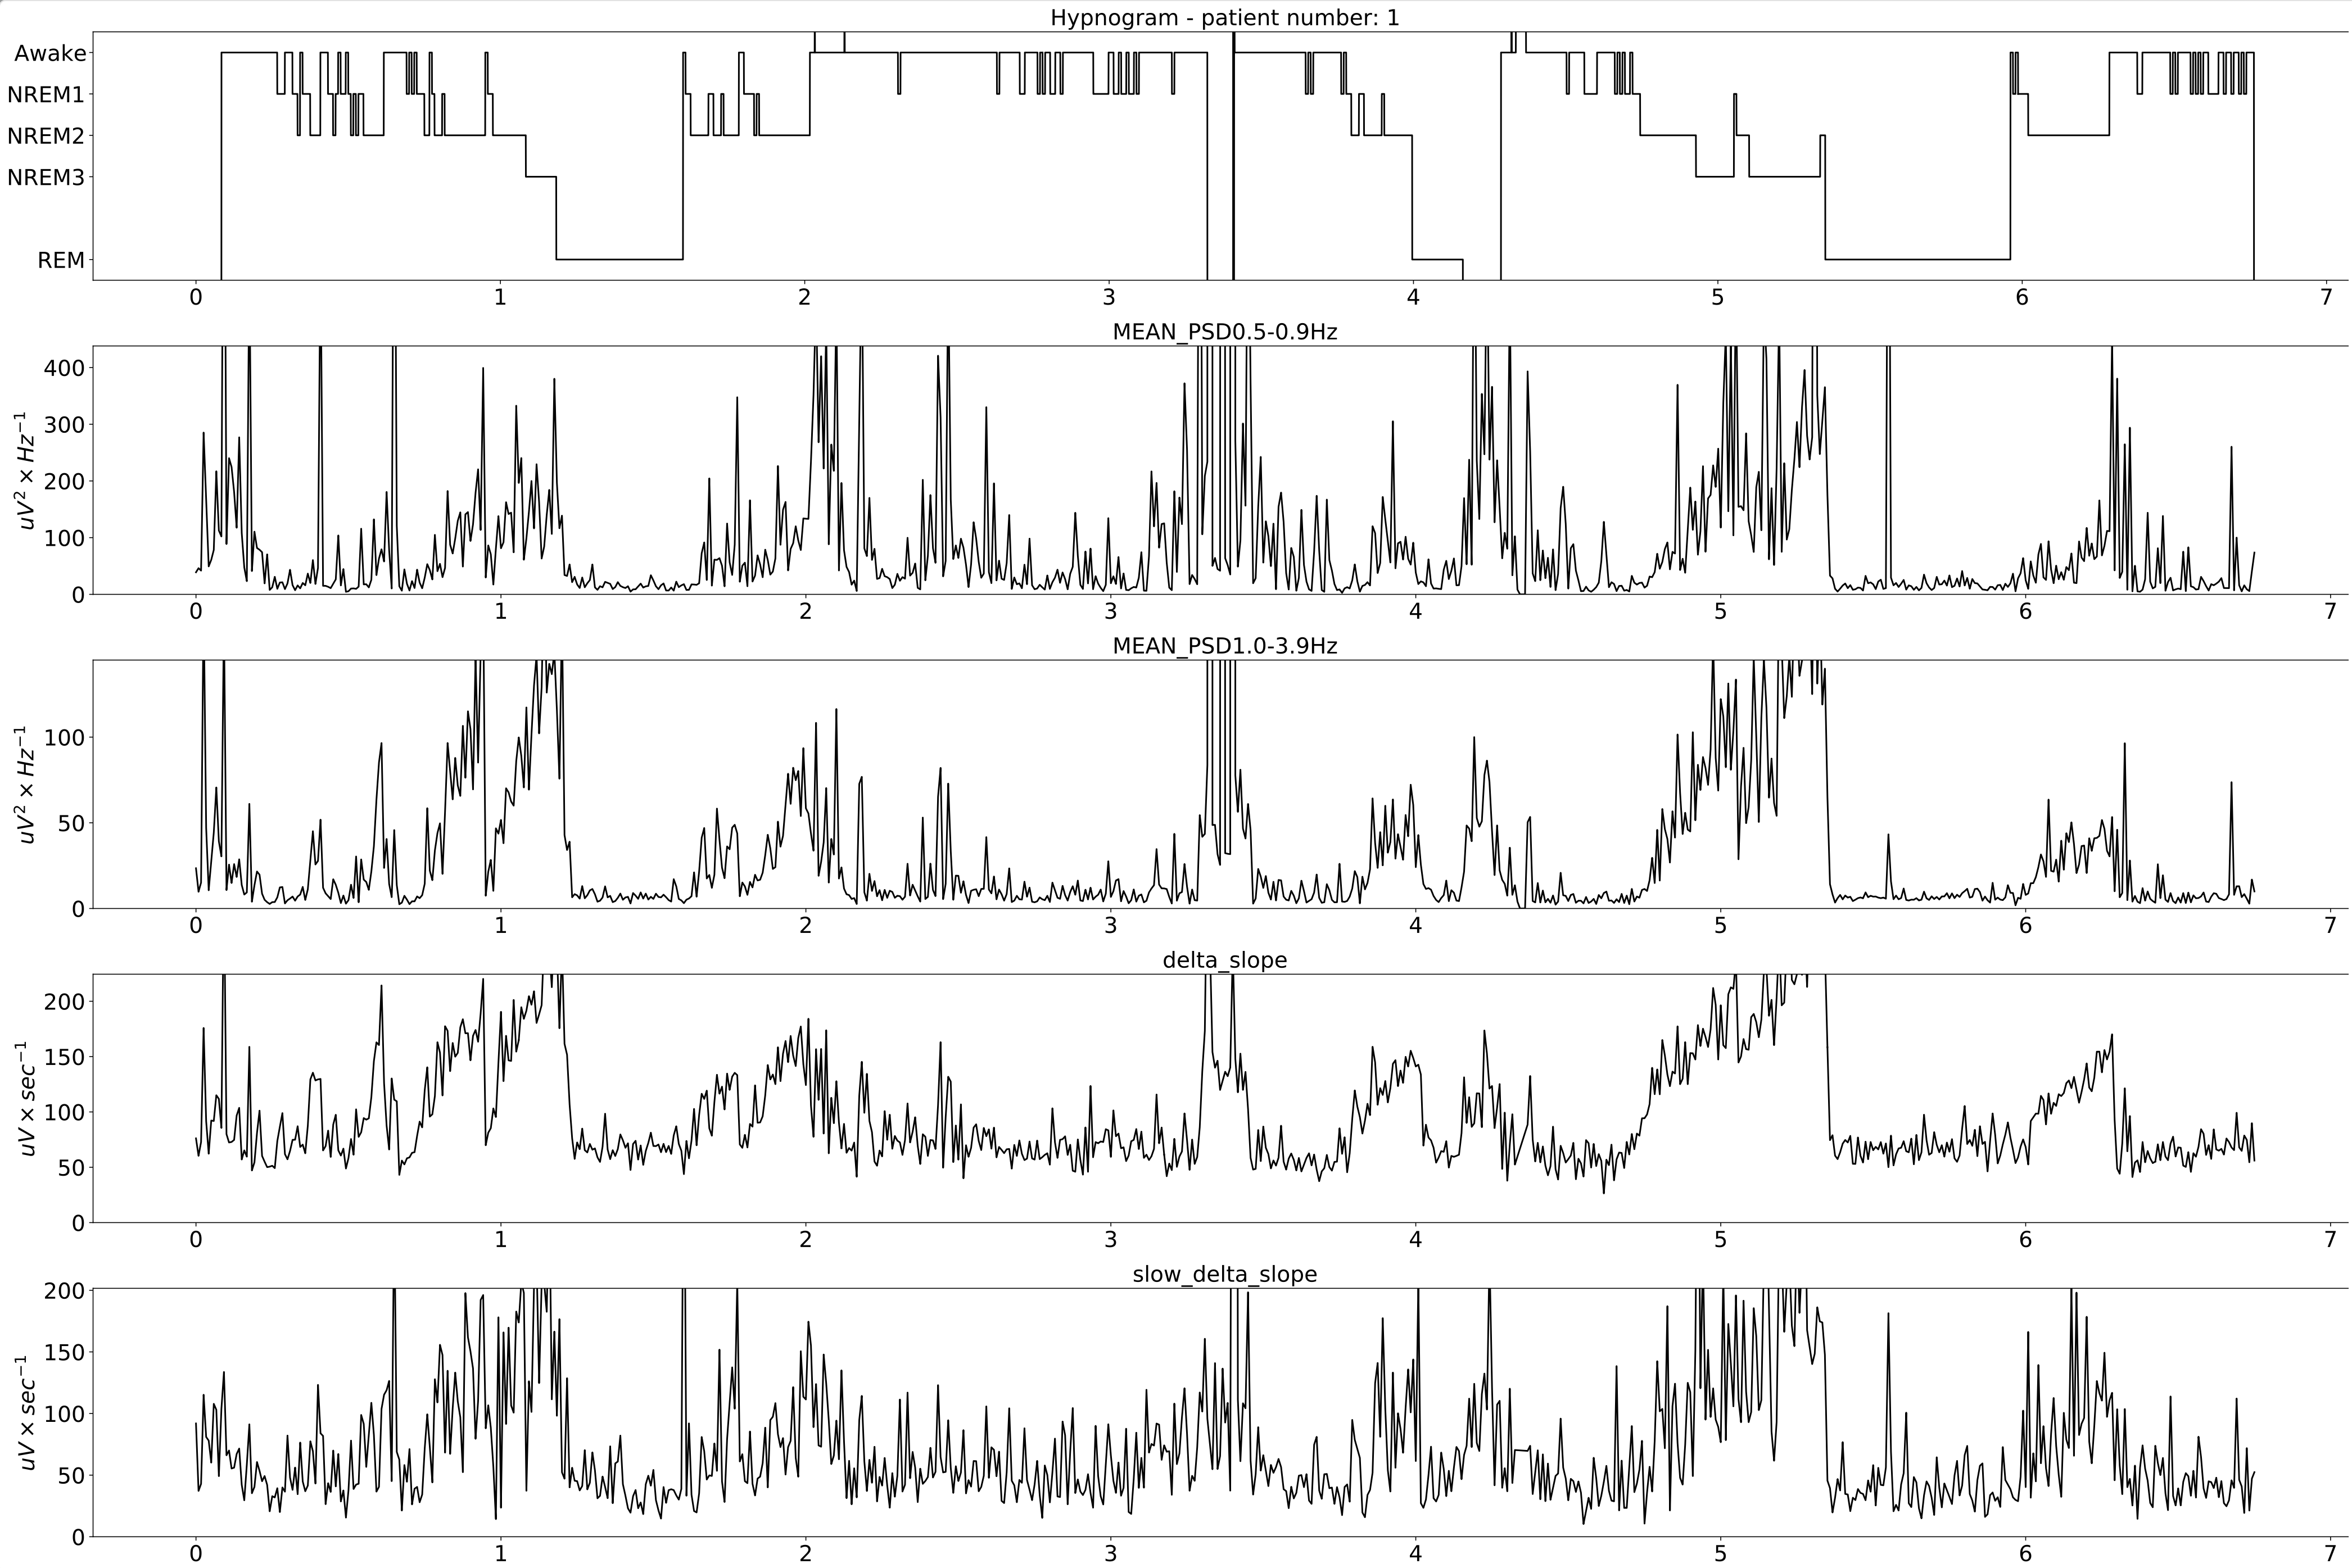
Extracted features for the whole night.